Early on in my career, I was a Solaris Systems Administrator.
Solaris, we’d scoff, is far superior an Operating System to Linux. When asked why, we’d point to three things: Solaris Zones, ZFS, and DTrace.
Then along came Oracle. They acquired Sun Microsystems, closed-sourced Solaris, ratcheted up licensing fees and laid off most of Sun’s talent. Within a few short years, they had killed Solaris, leaving Linux to pick through the bones.
![]()
Linux got Zones, in a big way. They eventually called it Docker and used it to revolutionise the way we deliver software.
Linux also got ZFS, through OpenZFS.
But Linux never did get DTrace…Until now, that is.
Well, sort of. bpftrace is the spiritual successor to DTrace. Like DTrace, it enables the tracing of pretty much any activity that happens within the OS. Like DTrace, it has a powerful scripting language and suite of tools. But where the two differ is that bpftrace is built atop a revolutionary technology called eBPF.
eBPF allows the running of sandboxed code in response to events occurring (or, more properly, probes firing). This facilitates the tracing (and even modification) of any program running in both user-space and kernel-space. There are many resources out there for eBPF; it has its own homepage, and even a movie!.
However, writing and running eBPF programs is a non-trivial exercise. It requires knowledge of C, and a learning curve steep enough to deter all but the most adventurous of engineers. This is where bpftrace comes in: it acts as a front-end for eBPF. It allows one to specify probes and actions through a scripting language, and transparently handles the attaching of those probes into the kernel.
The visibility and debugging powers that bpftrace provides are truly game-changing, and what better way to illustrate them than with a pointless example: let’s build a key-logger!
The Key Logger
Our example will do one simple thing: log every bash command which is run by any user across our OS.
But where to start? There must be a function which is responsible for reading bash commands from the terminal.
We could use bpftrace to figure out which function is called when entering commands. But in the interests of keeping this article simple, let’s just say there is a function, and it’s called readline.
Bash is of course OSS, and we can see the actual function code here.
The function signature of readline() looks like this:
/* Read a line of input.  Prompt with PROMPT.  An empty PROMPT means
   none.  A return value of NULL means that EOF was encountered. */

char * readline (const char *prompt)
readline is a function that takes a string prompt - i.e. some message to prompt the user into entering some text - and returns a string. The string is the text that was duly entered by the prompted user, delimited by a newline. But don’t take my word for it, let’s observe it in action, using bpftrace.
In order to do this, we’ll use a certain flavour of eBPF probe, a uprobe.
First, what is a probe? A probe is an eBPF program that can be attached to a given location in any code. For ‘location’ think function (or, more properly, symbol). Whenever that function is invoked, the probe fires, and the eBPF program is executed.
Uprobes are the user-space variant of a probe (the kernel-space equivalents are called kprobes, there are also tracepoints and many other probe types).
Our First Bpftrace Script
OK, We need to attach a uprobe to the readline symbol in the bash binary.
As a brief aside, if we didn’t know the symbol we needed to inspect, we can list all the symbols of a compiled binary using the objtool command:
$ objtool -T /bin/bash | grep readline
A bpftrace probe which matches the readline symbol is constructed like this:

And we can use that probe in a bpftrace program like:
bpftrace -e 'uprobe:/bin/bash:readline { printf("%s\n", str(arg0)) }
Let’s unpack this a little bit.
The bpftrace -e bit tells bpftrace to execute the command that follows, making this a one-liner.
This is followed by our probe uprobe:/bin/bash:readline.
Whenever this probe fires, the code within the curly braces will be executed: { printf("%s\n", str(arg0)) }.
The code itself should be immediately recognisable as a printf statement, but the str(arg0) argument bears some explaining…
With uprobes we get access to the actual arguments that the function was called with, conveniently populated as arg0...argN. These arguments are always uint64s and so need to be cast to their concrete types. In our case, the str() function de-references the argument.
Now, if we run that bpftrace command in one terminal session, and then hit return a couple of times in another, we should see some output like this:
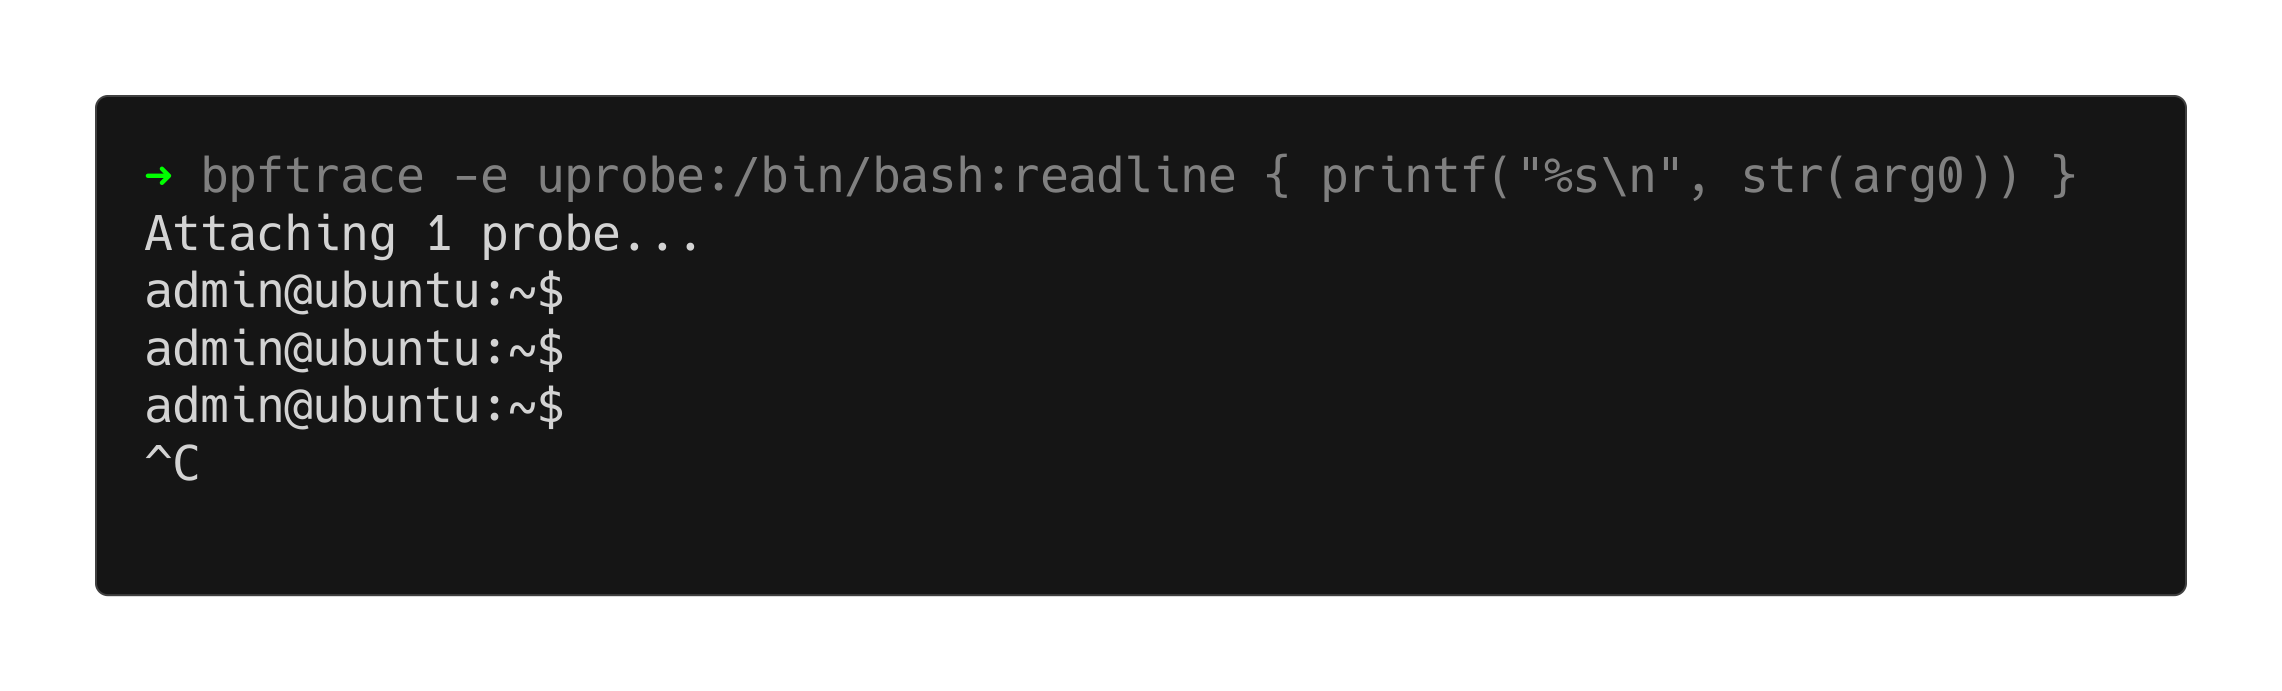
This is, of course, our prompt (the ever pliable PS1), which is nice…but not quite what we are looking for. We’re building a key-logger, remember? We need to see the text that the user entered in response to the prompt. We need the return value of readline, and for that we need a slightly different breed of uprobe, a uretprobe.
As you’ve maybe intuited, uretprobes work exactly the same way as uprobes except they fire when a function returns, not when it is called.
bpftrace -e 'uretprobe:/bin/bash:readline { printf("User %d entered %s\n", uid, str(retval)) }'
Notice too that there is a slight change to the printf statement, we are now printing the value of retval. This is a bpftrace builtin which is set to the return value of the function being traced (in C, functions can only return a single value). For added bonus points we are also printing the uid of the user being key-logged.
If we run this command in one terminal, and enter some commands in another we should see this:
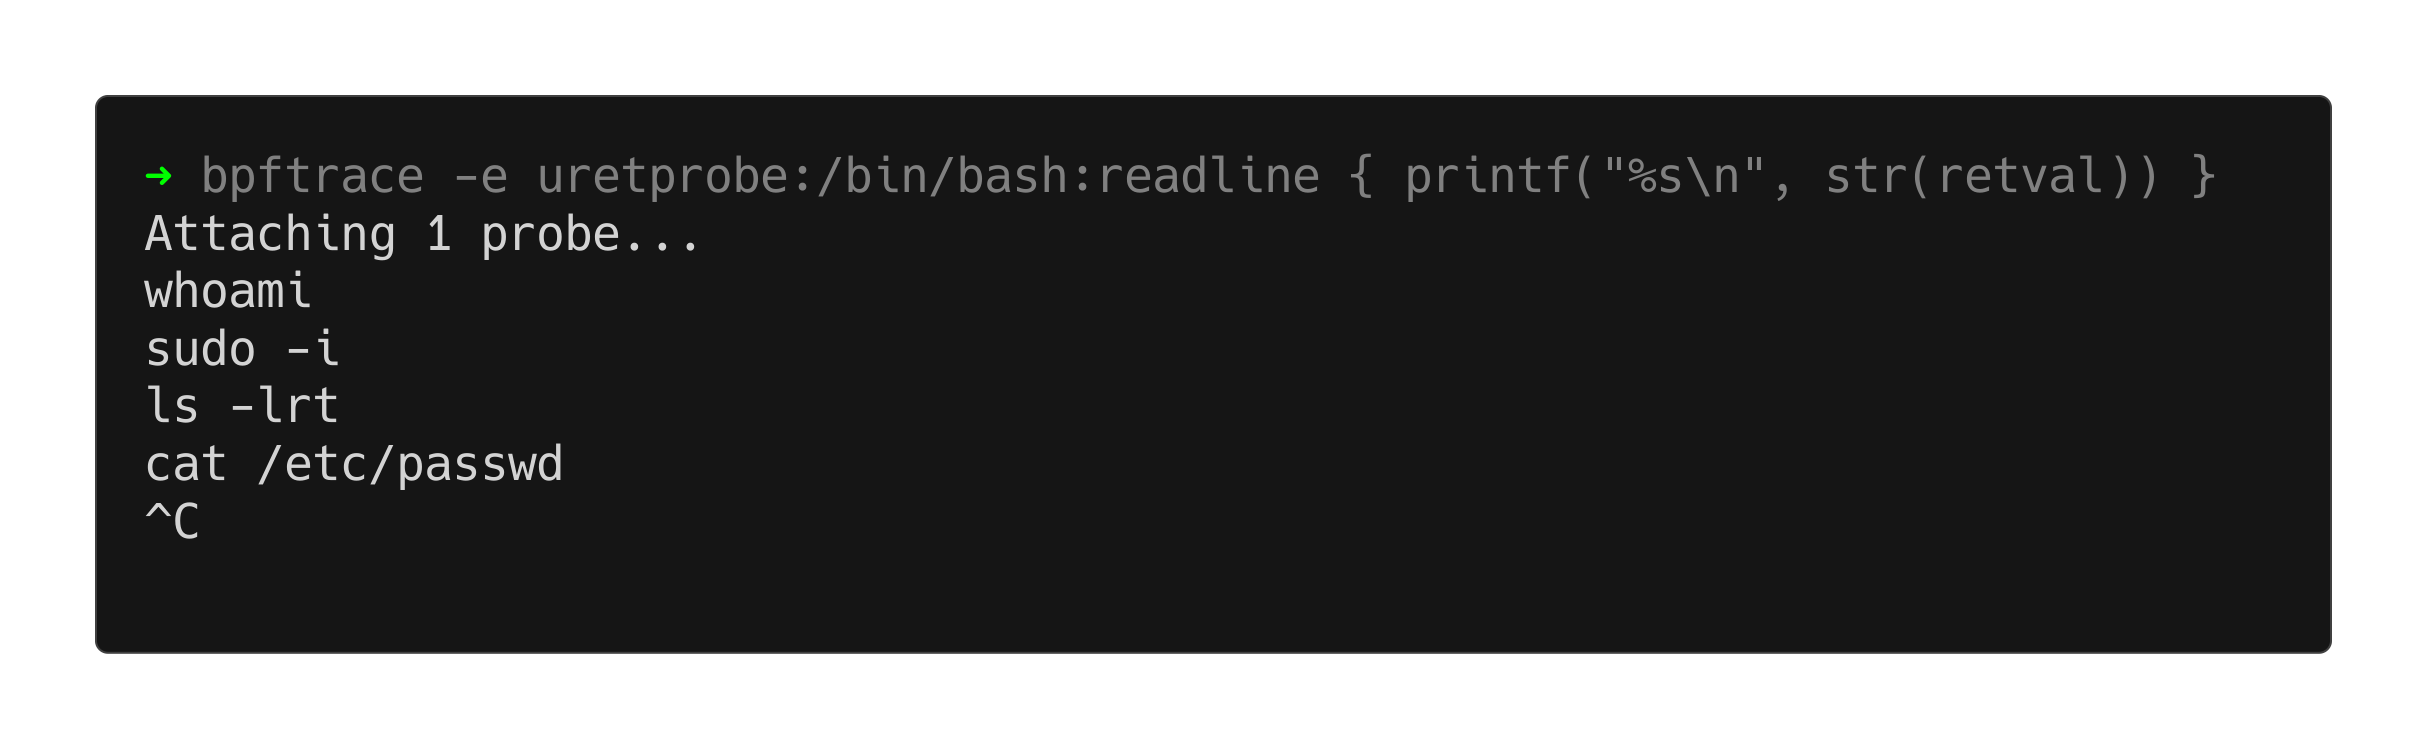
There - we are logging every bash command that any user across our system executes!
Summary
Now, clearly our key-logger isn’t going to change anybody’s life. BUT, let’s just step back and reflect: we attached a probe that will fire whenever a particular user-space function is invoked. We were able to log both the function arguments and its return value, and we did all this with a single one-liner. And we’ve barely scratched the surface of what bpftrace can do, the possibilities are endless.
When I discovered DTrace as a fresh-faced engineer, it opened a portal into a hitherto uncharted world. I could suddenly witness the inner workings of the OS, and its interactions with CPU, memory and hardware; it led me into a 20-year dalliance with systems programming and OS internals. I like to think that bpftrace can do the same for a new generation of engineers. Thanks for reading!

